Thursday 22 August 2013

Conversion Guide: UK Grading (WAM) to US Grading (GPA/IPK)


as presented on: http://www.fulbright.org.uk/pre-departure/academics/marks

Conversion Guide: UK Grading (WAM) to US Grading (GPA/IPK)

One important difference to be aware of is the emphasis on continual assessment. Most UK/Australia universities determine your marks based on your performance on examinations at the end of term. In the US, the papers and problem sets you complete during the term are often weighted as heavily as midterm exams and final exams.
Some classes may have weekly quizzes and daily homework, and you may not even have a final examination. Therefore, it is very important that you take these periodic evaluations just as seriously. At the beginning of each term, your professors will provide you with a syllabus detailing the assignments for the class and the weight (or percentage of the final mark) of each assignment as well as their expectations of you.
As an example, your final grade may consist of 10% class participation and attendance, 15% weekly quizzes, 15% daily homework, 20% papers (more than one per term) and 40% divided between a midterm exam and final exam. If you are ever unsure of how you are being evaluated, do not be afraid to ask!

Marks

US marks, or grades, are expressed differently than in the UK/Australia. The overall percentage (0-100%) for each class is converted into a letter grade (A, B, C, D or F), which is then recorded on the student’s transcript. Some universities also use the +/- system which allows for a wider range in determining students’ grade point averages.
The cut-off percentages vary by university, by department and sometimes by class. However, they tend to follow a system in line with the chart below. In the US, it is usual for students to receive marks in the 80-100 percentage range as this is considered the threshold for "good" work.

How to Calculate a GPA

A GPA (Grade Point Average) is one cumulative number to represent all of the marks earned during your undergraduate and postgraduate study to date. Each semester, your GPA is re-calculated to account for your most recent grades.
US PercentageUS GradeUS GPA
90-100A4.0 (A+ = 4.33; A- = 3.67)
80-89B3.0 (B+ = 3.33; B- = 2.67)
70-79C2.0 (C+ = 2.33; C- = 1.67)
60-69D1.0 (D+ = 1.33; D- = 0.67)
0-60F0

To calculate your GPA:

1. First the professor will convert your percentage grade to a letter grade, which is the final grade that will be reported to you
2. This letter grade is then converted into a grade point (each letter has a corresponding value)
3. Each grade point is weighted by the number of credits that class is worth
4. Each weighted grade point (for each class) is added together
5. Finally the sum of all your class grades is divided by the sum of the hours your classes are worth
For example, if you received an A- in a 4 credit class and three B+’s in 3 credit classes:
(4 X 3.67) + (3 X 3.33) + (3 X 3.33) + (3 X 3.33) /13 = 3.43
This would be a good GPA for your first term in the US. Sometimes a major GPA is calculated separately from the overall GPA. The overall GPA represents all marks the student has earned, including the general education classes, the major classes and the minor classes, while the major GPA represents only the coursework completed for the major.

Class Rank

Unlike in the UK/Australia, some US universities rank their students according to their GPA. The valedictorian is the student with the top GPA, while the salutatorian is the student with the second highest GPA.
Other students can graduate with “honours” (called by its Latin translation, cum laude) or even “great honours” and “greatest honours” (magna cum laude and summa cum laude).

Conversion Guide

A rough guide for converting between the UK/Australia and US grading systems can be found below. If you are studying in the US for a short period of time, your UK/Australia university will most likely apply its own system of grading.
UK ClassUK PercentageUS GradeUS GPA
First70-100A4.0
Upper second60-69B+/B3.0-3.33
Lower second54-59B/B-2.67-3.0
Third42-53C2.0
Pass38-41D1.0
Fail0-37F0

Please note that the percentage values differ greatly between the US and the UK/Australia. This is important to keep in mind when applying to a school. If asked for a percentage, do not list your UK/Australia percentage as a US percentage. They are not the same!

Tuesday 20 August 2013

Mengurai Kisah Pengalaman Tugas Belajar di Negeri Kanguru

dikutip dari: http://sdm.pupukkaltim.com/node/730

August 15, 2013 by 8301982


Siapapun yang ingin belajar di Negeri Kanguru, tentu akan menjadi pengalaman baru yang menyenangkan. Betapa tidak, Australia dengan julukan Kangurunya tersebut, dalamProgram Penilaian Pelajar Internasional secara berkala selalu masuk lima besar dari tiga puluh negara maju utama (negara-negara anggota Organisasi untuk Kerjasama dan Pengembangan Ekonomi).
Karena itu, untuk mengetahui lebih jauh lagi terkait proses belajar di luar negeri, untuk kedua kalinya Selasa (13/8) PT Pupuk Kaltim (PKT) kembali menggelar sharing knowledge yang bertajuk pengalaman tugas belajar. Bertempat di Lantai 2 Gedung Diklat PKT, kali ini perusahaan industri strategis tersebut menghadirkan karyawannya yaitu, Muhammad Burmansyah untuk memaparkan pengalamannya selama belajar di Australian School of Business, University of New South Wales (UNSW), Sydney, Australia. Dalam acara itu, sekiranya dihadiri 22 orang yang terdiri dari beberapa karyawan PKT dan calon karyawan angkatan pertama 2013.
Menurut Burmansyah, sebelumnya perlu diketahui beberapa hal tentang segala tahap persiapan yang harus dilakukan, hingga bagaimana nantinya ketika telah hidup disana. Harapannya tentu agar kita lebih mudah menyesuaikan diri dengan kehidupan di Australia.
Pertama, pemilihan universitas. Di Australia banyak memiliki universitas, ada sekitar 42 universitas (39 universitas Australia, dua universitas internasional, dan satu universitas swasta khusus). Dari sekian itu, pastinya kita akan dihadapkan pada pemilihan. Namun, banyak cara yang dapat kita lakukan diantaranya, search on-line melalui google, wikipedia, dan sebagainya, pelajari website university yang akan dituju, memilih antara coursework program (perkuliahan reguler) atau research program (pengajuan proposal penelitian), serta dapat berkonsultasi dengan teman, student centre atau education agency
Kedua, proses acceptance letter.  Tahap ini dapat dilakukan dengan apply on-line atau melalui education agency, melengkapi persyaratan administrasi dan minimum english requirements, seperti TOEFL iBT, IELTS dan/atau Analytical Skills, seperti GMAT/GRE, serta menyetor deposit fee.
Ketiga, persiapan berangkat. Dalam tahap ini, kita diharuskan segera mengurus studentvisa dan asuransi kesehatan, komunikasi dengan student counselor di University. Sebelum berangkat pun, ada baiknya kita telah menghubungi teman-teman pelajar Indonesia di negara tujuan, dengan maksud agar segala info terkait akomodasi, makanan, cuaca, swalayan atau departemen store terdekat, dan lain-lain dapat diperoleh secara jelas. Saat packing, jangan melupakan hal mendasar yang mesti disiapkan seperti, pakaian, surat-surat penting, alat-alat listrik, uang AUD atau ATM berlogo Visa/Mastercard, serta rekening bank (international transfer). Ada empat bank utama di Australia yaitu ANZ, National Australia Bank, Westpac, dan Commonwealth Bank. Untuk peralatan listrik, kita boleh membawa masuk sembarang peralatan elektronik pribadi misalnya, handphone, iPod, komputer/laptop, dan sebagainya. Australia menggunakan sistem soket tiga pin dengan bekalan elektrik 240 volt 50 Hz AC. Contoh adaptor yang diperlukan.
Keempat, saat telah sampai di Australia kita harus dapat beradaptasi terhadap perubahan cuaca (4 iklim) datang ketika winter season. Kemudian kita pun harus mengenal rute transportasi umum (bus, train, ferry, tram), serta melakukan visit to student international centre (student ID Card, akses web-portal). 
Kelima, masa perkuliahan. Tahap ini kita akan memilih mata kuliah yang sesuai minat, mempelajari course outline, terutama pembobotan antara examgroup assignment,individual assignment, class participation, dan sebagainya. Kita juga harus pandai untuk memanfaatkan consultation hour dengan lecture in-charge, dan segala fasilitas library(komputer, booking room, printer, scanner, dll). 
Perlu diketahui jika kita memutuskan hidup di Sydney, maka kehidupan disana terbilang paling mahal di Australia. Misalnya, untuk sewa unit apartement berkisar A$ 300 – 500 per week, listrik A$ 100 – 160 per month, air gratis, pulsa hp A$ 30 – 50 per month, makanan jadi A$ 8 – 15 / porsi, cukur rambut A$ 12.


Saat di Australia, akan sangat bermanfaat pula jika kita dapat terlibat dalam Komunitas Pelajar Indonesia. Sebab, dengan keterlibatan aktif untuk berbagi info, akan dapat membantu mempermudah kita terhadap segala kesulitan dan kendala yang dihadapi disana. Ada 2 komunitas yang dapat kita temui disana, seperti PPIA (Perhimpunan Pelajar Indonesia Australia) dan KPII (Komunitas Pelajar Islam Indonesia). Pada akhirnya, melalui tulisan singkat ini semoga dapat membantu memberikan bayangan di awal kepada kita tentang Australia, sehingga siapapun yang hendak kesana tidak akan menemukan kesulitan, dan yang terpenting kita dapat menikmati proses belajar dengan baik. (*/Irma Syafni)


Thursday 1 August 2013

Ringkasan perkembangan industri pupuk di Australia

Kurs: Rp.9.400/A$
  • Petani Australia mengkonsumsi pupuk setiap tahunnya sebanyak 5 - 6 juta ton dan lebih dari 50% stock yang ada diperoleh melalui impor. Oleh karenanya, kenaikan/penurunan harga bahan baku internasional sangat mempengaruhi tingkat serapan pupuk dan kemampuan produksi dari perusahaan pupuk lokal. IBIS Report Australia memprediksi selama tahun 2013-2018, industri pupuk di Australia dapat menghasilkan penjualan sebesar A$4.69 milyar/tahun dengan pertumbuhan industri mencapai 2%. 
  • Konsentrasi persaingan industri di level Medium dengan 2 (dua) perusahaan pupuk terbesar di Australia, yaitu Incitec Pivot dan Wesfarmers, menguasai 57.4% pangsa pasar. Persentase ini dipengaruhi oleh persaingan bisnis di bagian hulu dan hilir (vertical integration). Sebagai contoh: Incitec Pivotmelakukan serangkaian merger dan akuisisi terhadap perusahaan tambang penyedia bahan baku rock phosphate (backwards integration) dan perusahaan Southern Cross International yang mengatur penjualan di tingkat distributor dan retail (forward integration). Hal ini membentuk rintangan  tersendiri bagi kompetitor baru yang akan masuk ke pasar Australia.
  • Profitabilitas dipengaruhi oleh struktur biaya produksi yang terdiri dari pembelian bahan baku (57.7%), pembelian energi terutama gas alam (11.1%), upah tenaga kerja (6.7%), depresiasi asset tetap (3.5%) dan biaya lainnya seperti biaya angkut, biaya penjualan, dll.
  • Sesuai data Australian Bureau of Statistics, pabrik pupuk sebagian besar beroperasi di tepi laut (seaboard) terutama di sentra pertanian kawasan Queensland, Victoria, Western Australia dan New South Wales. Sejak tahun 2009 sampai saat ini, empat negara bagian tersebut menghasilkan 90% dari kebutuhan pupuk dan juga produksi pertanian.
Incitec Pivot Limited (IPL) --> market share sebesar 44,2%


  • Beroperasi di kawasan timur Australia yaitu di wilayah Queensland, New South Wales dan Victoria, memproduksi urea, diammonium, monoammonium, single-strength superphosphates dan anhydrous ammonia.
  • Berdasarkan laporan keuangan per tanggal 31 Maret 2013, IPL memiliki pendapatan sebesar A$1426,9 juta dan laba setelah pajak sebesar A$110,2 juta (atau Rp.1,04 trilyun). Saat ini memiliki karyawan sebanyak 5.200 orang.
  • IPL merupakan perusahaan hasil merger antara Incitec Fertiliser Ltd dengan Pivot Ltd dan perusahaan bahan peledak Dyno Nobel. Mengalami kenaikan grafik ekspansi usaha selama beberapa tahun ini dan termasuk peringkat 50 terbaik perusahaan yang listing di ASX (Australia Stock Exchange). Per tanggal 01 Agustus 2013, saham perusahaan diperdagangkan sebesar A$2.69,-/lembar.
  • IPL tercatat memiliki multichannel distribution route dengan lebih dari 200 distributor dengan kemampuan pendistribusian sebanyak 60.000 ton per hari. Unit usaha utamanya adalah Incitec Pivot Fertiliser (IPF), Southern Cross International (SCI) dan bahan peledak.
    • IPF mengoperasikan enam pabrik dengan kapasitas produksi tercatat sebesar 3,4 juta ton  yang terdiri dari single superphosphate, urea and ammonia.
    • SCI, perusahaan yang diakusisi pada tahun 2006, terlibat dalam perdagangan pupuk, industri manufaktur ammonium phosphates dan industrial chemicals. Salah satu pabrik yang dioperasikan adalah Phosphate Hill, QLD dimana disana dilakukan penambangan phosphate rock yang dikombinasikan dengan sulphuric acid dari pabrik Mount Isa sehingga dapat menghasilkan pupuk ammonium phosphate.
    • Unit usaha bahan peledak merupakan unit yang strategis dan IPL terlihat memprioritaskan investasi pada unit usaha ini. Saat ini menghasilkan 70% dari laba perusahaan dan diprediksi dapat naik mencapai 80% apabila pabrik Moranbah telah beroperasi yang dikombinasikan dengan Dyno Nobel Asia Pacific dan Dyno Nobel Americas.
  • Untuk kedepannya, analis memprediksi IPL akan melakukan peningkatan produksi Ammonimum Nitrate (AN) melalui pabrik baru di Moranbah dengan kapasitas 330.000 ton ammonium nitrate, ammonia and nitric acid per tahun. Selain itu, IPL telah melakukan feasibility study untuk membangun world-scale ammonium nitrate plant di Kooragang Island, NSW yang diestimasi selesai April 2013. Sebagian besar hasil produksi akan dijual ke perusahaan manufaktur bahan peledak, diantaranya Orica Australia.
Wesfarmers CSBP Ltd (CSBP) --> market share sebesar 13,3%

  • Wesfarmer Limited merupakan perusahaan konglomerasi Australia yang memiliki beberapa usaha selain pupuk. Divisi usaha yang menangani pupuk adalah CSBP yang menghasilkan 3% dari penjualan group secara keseluruhan. CSBP memusatkan produksinya di Kwinana, WA dengan kapasitas produksi 1 juta ton pupuk per tahun terdiri dari superphosphate pasture fertiliser (500.000 ton), Agras range of compound fertilisers (400.000 ton) dan selebihnya Cresco range of home garden fertilisers.
  • Di tahun 2011-2012, secara group Wesfarmers menghasilkan penjualan sebesar A$ 57,7 milyar dan laba setelah pajak A$2,1 milyar. Analis memprediksi penjualan Wesfarmer-CSBP di tahun 2012-2013 bisa mencapai A$563 juta atau Rp.5,3 trilyun dengan kenaikan per tahun mencapai 3.7%.
  • Untuk kedepannya, analis memprediksi CSBP akan meningkatkan kapasitas input phosphate rock untuk pabrik superphospate nya di Kwinana, WA dimana bahan baku ini diperoleh dari  wilayah lainnya di Western Sahara sebanyak 60-70% dari total kebutuhan. Selain itu, CSBP juga telah mempublikasikan di akhir tahun 2011, rencana peningkatan kapasitas produksi ammonium nitrate (AN3) di pabrik Kwinana sehingga bisa mencapai produksi 780.000 ton per tahun.
Impact Fertilisers Australia Pty Ltd --> market share kurang dari 5%
  • Berlokasi di Tasmania, memproduksi single-strength superphosphates di pabriknya di Derwent Park, TAS. Memiliki empat distribusi center di Australia bagian timur dan sembilan depot di Tasmania. 
  • Memproduksi 200.000 ton single-strength superphosphates per tahun, dan dari jumlah tersebut sekitar 120.000 ton dipasarkan ke sentra pertanian di tepi timur Australia.
Regulasi dan Peraturan Pemerintah
  • Perusahaan pupuk di Australia tunduk pada peraturan the Agricultural & Veterinary Chemicals Act 1994. Peraturan pemerintah ini mengatur tentang tatacara pembuatan pupuk sampai dengan penjualannya.
  • Selain itu terdapat lisensi khusus untuk membawa dan memindahkan produk yang mengandung nitrogen serta pengaturan level pencemaran udara berupa emisi karbon dari produksi amoniak yang diatur secara khusus oleh Hazardous Waste (Regulation of Exports and Imports) Act 1989.
Lampiran:

I. Fertiliser Australia, mencatat supplier pupuk yang memasok produk ke Australia, yaitu:
source: http://www.fertilizer.org.au/default.asp?V_DOC_ID=1174
    II. Data perbandingan penjualan produk pupuk antara produksi lokal dengan produk import di Australia:
      source: http://www.fertilizer.org.au/default.asp?V_DOC_ID=1176

        III. Referensi
        1. IBIS Industry Report: C2531 Fertiliser Manufacturing in Australia industry report.pdf
        2. ASX Announcement during 2013 for Incitec Pivot Limited (IPL), <http://www.asx.com.au/asx/statistics/announcements.do?by=asxCode&asxCode=IPL&timeframe=Y&year=2013>
        3. Fertiliser Australia: Domestic Fertiliser Market, <http://www.fertilizer.org.au/default.asp?V_DOC_ID=1176>
        4. ABS, 2012, Australia Bureau of Statistics, 4627.0 - Land Management and Farming in Australia: Fertiliser Use, <http://www.abs.gov.au/ausstats/abs@.nsf/Products/4627.0~2009-10~Main+Features~Fertiliser+use?OpenDocument>
        5. Incitec Pivot Limited website: Investor Home, <http://investors.incitecpivot.com.au/phoenix.zhtml?c=170340&p=irol-IRHome>

        Wednesday 19 June 2013

        M&A: Cross Border Deals, Joint Ventures and Strategic Alliances


        Cross border M&A deals: acquirer and target firms are registered in two different countries.

        Foreign Expansion/Entry Modes:
        • Representative Office:
          • is an office established by a company to conduct marketing and other non-transactional operations, generally in a foreign country where a branch office or subsidiary is not warranted.
          • Easier to establish than subsidiary or branch, simple, low cost model and less incentives to be regulated.
        • Strategic Alliance: 
          • an agreement between two or more parties to pursue a set of agreed upon objectives need while remaining independent organizations. 
          • The alliance is a cooperation or collaboration which aims for a synergy where each partner hopes that the benefits from the alliance will be greater than those from individual efforts. 
          • The alliance often involves technology transfer (access to knowledge and expertise), economic specialisation, shared expenses and shared risk.
          • Forming a contract between foreign partner and local company.
        • Joint Ventures:
          • a business agreement in which the parties agree to develop, for a finite time, a new entity and new assets by contributing equity. They exercise control over the enterprise and consequently share revenues, expenses and assets. 
          • Co-own a local entity between foreign partner and local partner.
        • Greenfield Investment:
          • the investment in a manufacturing, office, or other physical company-related structure or group of structures in an area where no previous facilities exist.
          • set-up a new factory, start from scratch.

        Why Multi National Company (MNC) chooses M&As as the expansion mode?
        • Difficulty in selling directly into domestic market --> production cost too high, transaction cost too high, lack of local knowledge.
        • Difficulty in establishing a local factory --> lacks of local knowledge, uncertainty in the return of investment.
        • Difficulty to entering another expansion mode beside M&A (eg joint venture or an alliance) --> uncertainty about such relationship due to lack of local knowledge and how to resolve conflicts (potential hold-out problems in the future)
        How to view cross-border M&A?
        An entry mode that acquires local knowledge but allows the MNC to retain control.

        Strategic fits between foreign firms and domestic firms:
        • Foreign Firms: 
          • transfer of technology, brand, governance and organisation, cost of capital/diversification
        • Domestic Firms:
          • Country-specific marketing skills, distribution channel, connections, tax incentives.

        Barriers to cross-border M&A:
        • Home bias: cross border M&A targets tend to be from countries that neighbour and have strong links with home country.
        • Tax differences.
        • Capital control restrictions.
        Issues with Cross-Border M&As
        • Issues-1: M&A Deal constraint
          • M&A necessitate (make something necessary, force to do something) a sale of control of the entire target firm.
          • A sale can be difficult when the target and the acquirer have non-overlapping ZOPA. Why can be that the companies create synergies have non-overlapping ZOPA? Yup, maybe because lack of knowledge of other firm assets to value their synergy benefits.
          • In this context, a joint venture allows the synergies to be capture.
        • Issues-2: Incentives compatibility
          • After the target being absorbed, M&A mostly provide no clear performance measures, difficult to design incentives scheme for the target's managers (division). Thus, only an acquirer's shareholders can monitor progress.
          • In contrast, a joint venture allows both the acquirer and target to share ownership in a common project --> compatible incentives.

        Monday 17 June 2013

        Analysing Strategic Risks and How To Measure


        Strategic risk, definition:
        • an unexpected event or set of conditions that significantly reduces the ability of managers to implement their intended business strategy (Simons, 2000)
        • uncertain future events which could influence achievement of the organisation's objectives, including strategic, operational, financial and compliance objectives (PricewaterhouseCoopers)
        Operations risk: 
        • breakdown in a core operating, manufacturing or processing capability, example: defective products, neglected maintenance leads to breakdowns, lost in customer packages.
        • critical product or process failures, example: toxic substance mixed with a product formulation. 
        • often triggered by employee error, mostly are unintended and/or accidental.
        Competitive risk:
        • results from changes in the competitive environment that could impair the business's ability to successfully create value and differentiate its product and services.
        • Example: actions of competitors in developing superior products and services, changes in regulation and public policy, shift in customer tastes or desires (such as fashion fads), and changing in supplier pricing and policies.
        • Porter five forces.
        Asset impairment risk:
        • when it loses a significant portion of its current value because of a reduction in the likelihood of receiving those future cash flows.
        • 3 potential types:
          • Financial impairment: result from a decline in the market value of a significant balance sheet asset held for resale or as collateral. Example: currency devaluation decreased the expected value of future cash flows, a long-term bond portfolio may sink dramatically due to a rise in market interest rates.
          • Intellectual property rights impairment: related to intangible resources, example: due to unauthorised use of intellectual property by competitors (patent infringement), unauthorised disclosure of trade secrets to competitor or third party, etc.
          • Physical impairment: dur to physical destruction of key processing or production facilities, because of fire, flood, terrorist, or other catastrophe. 
        Franchise risk (reputation risk):
        • when the value of the entire business erodes due to a loss in confidence by critical constituents.
        • occurs when business problems or actions negatively affect customer perceptions of value in using the business's goods or services.
        • can negatively influence public perception and drive away customers.

        Risk Assessment Template:
        • Risk factor, eg. price fluctuation, competitive rivalry
        • Description, eg: 
          • Oil, natural gas & chemical prices can vary due to changes in supply and demand for products.
          • Product innovations, technical advances, intensifications of price competition by competitors, industry consolidation can impact operating results.
        • Risk Category: operation risk, competitive risk, asset impairment risk, franchise (reputation) risk.
        • Strategic impact: Low, Medium, High.
        • Reputation Risk: Low, Medium, High.
        • Uncontrollable --> Low, Controllable --> High.


        The risk exposure calculators:
        Analysis the pressure points inside a business that can cause strategic risks to "blow up" (occur).
        If the pressure builds too high, operations risk, asset impairment risk and competitive risk can cause irreparable damage. High score --> high risk (1 = no risk, 2 = medium risk, 3 = high risk).
        Three key analysis areas:
        • Growth: --> fundamental goals of the business but also bears risk pressure
          • Pressure for performance
            • goals are set at demanding levels with high performance expectations (or else risk punishment or possible replacement).
          • Rate of expansion
            • rapidly expanding scale of operations -- companies grow bigger, but resources, people and system often work beyond their normal capacity. 
            • As a result, mistakes and breakdowns may occur, operations error, increase credit risk, downgrade of product and services, etc.
          • Inexperience of Key Employees
            • growth also means hiring large number of new people, sometimes in the rush, background employee check may be waived and minimum performance standard and education qualification may be lowered.
        • Culture: --> history and top-management leadership style bears risk pressure
          • Reward for entrepreneurial risk taking
            • individual are motivated to be creative in finding and creating market opportunities, although it's a good thing, but in the risk taking management, such as: investment may be made in risky asset, deals may be struck with counterparts who have limited ability to honor contract, commitment made but difficult to fulfil, or employees may engage in behaviours that damage the reputation of business.
          • Executive resistance to bad news
            • culture also influence the willingness of subordinates to inform superiors about potential risks in the business. 
            • Early warning systems? How much employees fear in bearing bad news and communicate to senior management? Fear of sanction or other personal repercussions?
          • Level of internal comparison
            • cultures also foster spirit of internal competition, which bring a unique set of issues. Intense competition among subordinates targeting for bonuses or promotion. 
            • To enhance short-term performance and advance own careers, individuals may gambling with business assets, credit exposure, firm reputation. The payoff and costs are asymmetric, the worst situations the employees could lose their job and business fall to financial loss.
        • Information Management: -->
          • Transaction complexity and velocity:
            • high transaction volume and increased processing speed --> increase the possibility of operation risk.
            • As transaction become more complex, fewer people may fully understand the nature of transactions and how to control them.
            • Example: cross border agreement in international operations, creative financing, consortium agreement.
            • Without fully understanding contractual obligations and the nature of cash flows, asset impairment risk will increase substantially.
          • Gaps in diagnostic performance measures:
            • management may be unaware of potential problems, cannot take remedial action to contain the risk. All type of risk need to diagnostic appropriately to track current risk level and early warning indicators about changes in competitive risk and franchise risk should be in place.
            • may require specialised information processing system that can consolidate information across dispersed operations.
          • Degree of decentralised decision making:
            • In decentralised business, individuals are encouraged to make decisions autonomously and creates opportunities without constant monitoring and oversight by superiors.
            • Due to freedom environment, operating rules and constraints may be neglected. Consequently, they may be able to engage in activities that increase risk without requiring approval from corporate level managers.
            • Also, by decentralising credit approval, will increase the magnitude of credit risk.

        Example: Case Study - Luvano Wine Group (Australian Wine Company)
        • Growth:
          •  Pressure for performance: 2 to 3
            • intense competition and rivalry in Australia's wine industry.
            • Profit and growth target increased.
            • lots of competitors and very high competitive landscape.
          • Rate of expansion: 2
            • no rapidly growing, highly dependen to Australia wine market.
            • but, there's an increase of intense to expand to new areas outside Australia, such as Asia, America and European market as they already has good relationship with international distributor and perform an international joint venture
          • Inexperience of Key Employees: 1
            • strong management teams and only employs 570 people, including highly skilled and experienced vintrepreneurs. 
        • Culture:
          • Reward for entrepreneurial risk taking: 1
            • not enough information from case study
          • Executive resistance to bad news: 1
            • not enough information from case study
          • Level of internal comparison: 1
            • not have divisions, 
            • not enough information from case study
        • Information Management: 
          • Transaction complexity and velocity: 2
            • Medium, not very highly complex but not to simple, as they develop several international brands
          • Gaps in diagnostic performance measures: 1
            • Friendly and close related family business, not so hard to disclose bad news.
          • Degree of decentralised decision making: 2
            • Possessed subsidiary in England and US, not enough information about the constraint of operating rules and freedom of credit approval risks.
        • Total score: 13 to 14
        Risk Management and Controls (Simon)
        • Belief Systems --> Beliefs and core values empower employees to make decisions that align with the company's interests. Help organisation to manage risks (what employee have to do)
          • Example in Royal Dutch/Shell Group Statement of General Business --> "Shell companies insist on honesty, integrity and fairness in all aspects of their business and expect the same in the relationships with all those with whom they do business."
        • Boundary Systems --> Boundaries for business conduct provide clear, enforceable sanctions.
          • Example in Royal Dutch/Shell Group Statement of General Business --> "The direct or indirect offer, payment, soliciting and acceptance of bribes in any form are unacceptable practices". "Employees must avoid conflict of interest between their private financial activities and their part in the conduct of company business" 
          • But, we can recommend to Shell to state enforceable sanction, in which not clearly stated in their Group Statement.
        • Internal Control Systems --> Internal controls ensure any errors of omission and commission that do occur are detected.

        M&A: Brazos & Comark LBO Case Study


        Source: Harvard Business School Publishing, February 2004, Ref journal No. 9-202-090

        Introduction:
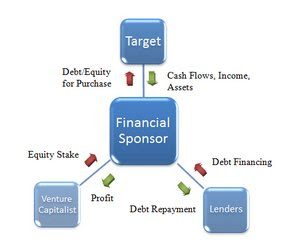
        • Brazos equity fund --> US middle market Leverage Buyout group (LBO).
        • LBO firms made money by buying established companies, fixing them or selling off various portions of assets, and eventually selling the enterprise itself. Usually these transactions were funded by significant amount of debt. As long as the company could carry the debt, selling the healthy parts or improving performance would generate cash to yield. When the company was sold, the bank loan would be repaid and the excess went to the partners in the fund.
        • Even when a buyout firm found a good target, obtaining a necessary leverage to complete the deal was a challenge. Generally two types of leverage were used:
          • Senior Debt:
            • provided by financial institutions such as insurance companies and commercial bank.
            • Saving and loans scandal (early 1990s) inspired government to tighten regulations on senior debt, created a significant degree of risk aversion among lenders.
            • Another contraints: the consolidation of the banking market.
          • Subordinated Debt --> consist of high-yield (junk) bonds, issued in the name of the acquired company, or privately placed debt (unsecured debt with an equity conversion feature)
        • Increasingly, buyout funds were moving away from the mega-buyout into new strategies, which included investing in less-efficient small-company segment, establishing investment focus, developing operating expertise, diversifying geographically, and into broader areas of private equity, such as venture capital and mezzanine financing:
          • a hybrid of debt and equity financing that is typically used to finance the expansion of existing companies.
          • gives the lender the rights to convert to an ownership or equity interest in the company if the loan is not paid back.
          • it is treated like equity on a company's balance sheet and may make it easier to obtain standard bank financing
        Brazos
        • Brazos targeted firms with enterprise value between $25 million and $250 million, solid management teams and well-defined niches.
        • Most deals were relationship driven, local and offer real value. Need to be able to grow the company's cash flow organically and efficiently.
        • Developed a strategic relationship with Maverick Capital, a large fund that traded large-cap public equities, used it network and public market relationship to help Brazos research industries, conduct diligence and source deals.
        • How Brazos-LBO add value?
          • Differentiation through the Generation Transfer Transaction (GTT). 
          • Partnership with the family and the management team.
          • GTT is tax efficient, provides liquidity,  and continued operating control for the owner along with a flexible capital structure to accomodate future growth.
            • Owner would reinvest a sum to maintain 50.1% of the common stock of the new company.
            • Managers achieved liquidity and retaining significant equity ownership.
            • Transaction was an exchange of securities, thus cash would not be taxed until the new shares were liquidated. 
            • Brazos would buy 49.9% of the common stock and a block of preferred shares with attached warrants for the purchase of common stock. Also, arrange the senior debt financing for the balance of the purchase price.
          • Ensured the family could still control the firm as long as it met certain performance targets, if the performance not achieved, Brazos would own more of the firm and receives greater purchase price when it was sold.
          • Brazos as a minority had protections, such as significant board representation, supermajority right to block major changes, and in the case of severe under-performance, they had the right to take control of the board.
         The Comark Deal
        • CoMark, a speciality manufacturer of commercial modular buildings. As of September 2001, CoMark's revenues were $35 million with an adjusted EBITDA of $10.6 million. CoMark sold to 3 major segments: government agencies (73%), education (22%) and private entities (5%).
        • Brazos interested to CoMark deal, because 
          • Comark has solid cash flow, good management, and a well-defined niche in building modular structures.
          • Comark is family based company and Brazos had experienced before in dealing with this type of business as they could leverage the operational efficiency and successfully deal with the family issues.
          • Diverse market segments and end-users, a good company in a good industry and was selling to the government effectively. 
          • Operating performance:
            • growing business.
            • government procurement provides stability.
            • high margin (custom-designed) products.
            • there seems to be a customer concentration issues, but this is where Brazos sees undervaluation.
          • Asset structure :
            • Mainly cash, inventory and physical assets.
          • Cash Holding:
            • Cash rich relative to size.
          • Capital structure :
            • zero debt.
            • banks do not understand the company.
            • comparable firm (Modtech): debt/asset = 21%
          • Government issues/management incentives:
            • good management, improving sales force
            • management incentives will decline after the transaction.
            • but this can be structured using earn outs.
          • Ownership structure:
            • Family business
            • No hold out problem, as the deal is subject to negotiation only
            • easy to set up contingent payment
            • easy to set up seller financing
          • Other issues about the company :
            • mixing up of personal and company expenses
            • mixing up of capital expenditure and operating expenses
            • poor record keeping
            • a night mare for any due diligence team.
        • Price:
          • CoMark's founders wanted $40 million.
          • But, the fund offered $38 million in cash at closing, with a deferred $2 million payment for each of the next 2 years if CoMark hit its 2002 and 2003 EBITDA projections. 
        • Financing:
          • CoMark's founders agrees to contribute through the provision of seller financing and reinvestment of capital into the company. Managers encouraged to reinvest $4 million of the purchase price in the form of equity (27% of firm's equity).
          • Provide 10 year 8% subordinated seller note, which gave Brazos a leverage to meet its return threshold and keep the founders involved, not only motivated by the earn-outs and substantial equity stakes, but they would also receive the seller note.
          • Seller note is more preferable rather than a mezzanine note, because of: 
            • mezzanine players sought return of 20%, which decrease Brazos return.
            • Going to mezzanine market, added a complexity to the deal.
            • Difficulty in financing environment.
          • Brazos could attracted bank interests, because: big loan ($16 million senior term loan, at a rate of LIBOR plus 425 basis point, or 6.25%) --> higher than 10 year Treasury Bond (4.65%)
          • "bank book" for potential lenders --> investment memorandum.
        • Structure:
          • Stock Purchase:
            • LBO purchase a portion of equity (73%)
            • No dissolution/liquidation of firms
            • Buyers assume all kinds of existing liabilities.
            • Sellers can automatically retain some ownership stakes (27% in this case). They can delay paying capital gain tax on this portion.
          • Asset purchase:
            • Purchase (and liquidation) of firm's assets.
            • Often involves the repayment of debt, and contracting of new debt.
            • Owners get 100% of residual value after debt repayment.
            • If they want to hold on to some equity stakes, they have to reinvest (purchase) equity of new firm.
            • Immediate capital tax gain to owners/sellers.
            • But assets sales create a goodwill amount, which can be depreciated and result in a tax shield for the firm.
            • may help avoid unwanted liabilities.

        Sunday 16 June 2013

        Analysing Strategic Pricing and Product Profitability

        Strategic importance of pricing and profitability decisions:

        • Price is the only marketing mix that generate money, which affects revenue growth and buyer behaviour.
        • Heavily influence to long-term and short term decisions of corporate strategy, which directly affects the creation of shareholder and customer values.
        • Major consideration of repositioning the company's competitive landscape, customer perceives about the company's products/services, which includes tangible/intangible attributes.
        Pricing approaches:


        • Economic Approaches
          • Based on laws of supply and demand --> to increase sales need to decrease sales price, thus marginal revenue will decrease as sales volume increase.
          • Therefore, it's argued that profits can be increased by increasing sales to the point where marginal revenues equal marginal costs (point of maximum profit: break even point)
          • Problems: 
            • Difficult to predict demand, up/down trends of uncertainty.
            • There're some other business considerations that more important than profit maximisation, for example: gives subsidise price to poor community in order to obey regulation and be a responsible corporation citizen, added price due to funding ecological sustainable process or first mover market penetrations that require lower prices to introduce new product/process.
        • Cost-based Approaches
          • Common approach --> based on % mark-up on identified costs.
          • However, the price set still need to be acceptable by customers and also must consider the competitor's reaction to price as well.
          • Pricing Process:
            • Determine customer wants --> 
            • Design product to meet customer wants (step 2)
            • Determining manufacturing or service procedures // determine necessary raw materials   --> 
            • Determine price (predict selected costs, add mark-up for other costs, add additional mark-up to achieve desired profit) -->
            • Evaluate the resulting price:
              • If acceptable, manufacture and sell.
              • If unacceptable, redesign --> back step 2.
          • Determining the mark-up price:
            • Variable Cost Approach : 
              • Avoids possible misinterpretation of fixed cost behaviour.
              • most useful in determining short-term pricing decisions.
            • Absorption cost approach:
              • Full manufacturing cost
              • Fairness in calculating mark-up.
            • Activity based approach
          • Drawbacks:
            • Relies on accurate cost assignment.
            • Assumes that customers are willing to pay the price set.
            • Can increase the time and cost of bringing new product to market.
        • Target Costing Approaches


          • Customer oriented approach to costing/pricing --> start with what customer is willing to pay and design a product to meet the price.
          • Target Cost = Sales Price - Acceptable Profit Margin
          • Strength:
            • Proactive approach to cost management --> pricing toward meeting customer needs
            • Encourage design for manufacture --> To meet the requirements of functionality, quality and price of customers perspectives, thus the company must consider cost of manufacturing and servicing of a product.
            • Reduce time to market --> break down barriers and meet directly to customer
            • Minimise non-value-adding activities --> reduction or elimination in the activity/process selection to meet target costs requirements.
            • Advantageous for products with short-life cycles --> encourages effective planning and design, less opportunity to make continuous improvements.
          • Drawbacks:
            • Detailed cost data required --> to choose the best activity alternatives
            • Required more cooperation and coordination between functional units --> may be problematic if there are cultural/political tensions between functional areas.
        • In seeking greater profitability, managers may be attempted to use pricing to gain unethical advantages over competitors, such as:
          • Predatory pricing --> reducing prices (to a low level) with the intentions of forcing competitors out of the market.
          • Price discrimination --> different prices, discounts, services or payments terms are offered to different customers for the same goods/services.
          • Resale price maintenance --> when a supplier dictates the minimum resale price
          • Price-fixing contracts --> fixing, controlling, or maintaining prices between competitors.
          • To control: Trade Practices Act 1974, and Australian Competition and Customer Commissions (ACCC)


        Pricing for Internal Customers -- Transfer Pricing

        • To accomodate the growth of internal customers and to make divisions accountable --> management must consider how transfer goods to internal customers should be reported
        • Internal value assigned to a product/services provided by one division to another.
        • Methods to charge price"
          • Market Price:
            • used when there is an established (and competitive) market price for the good/service transferred.
            • Compare to outside sales, managers may choose to remove their selling expenses.
            • free to source requirements from outsider.
          • Variable Costs:
            • appropriate methods if company has excess capacity.
            • However, the supplying divisions could not report profit from transfers made/loss equal to fixed costs.
          • Absorption Cost plus mark-up
            • include all variable and fixed manufacturing costs.
            • avoids problems due to fixed costs from supplying division.
            • allows for recovery of unallocated costs
        • Considerations: individual divisions may attempt to maximise their own performances, but this may be to detriments overall corporate performances.
        Profitability Analysis
        • Cost-Volume-Profit (CVP) Analysis
        • Contribution Income Statement